

You know that feeling when your dashboard shows green arrows everywhere—conversion rate up, website traffic climbing, social engagement through the roof—yet your agents are struggling to close deals and your monthly revenue keeps sliding?
Most real estate agencies track metrics backwards. They monitor what looks impressive in quarterly reports instead of what actually triggers the next action. Beautiful dashboards that tell you nothing about whether an agent needs help, a lead source is dying, or a promising opportunity is about to slip through the cracks.
The real problem isn't having too few metrics or too many. Traditional KPI dashboards operate like scoreboards when agencies actually need air traffic control—something that tells you not just where things stand, but what needs to happen next.
The dashboard evolution trap agencies fall into
A solo agent starts with a legal pad and tracks three things: appointments booked, offers written, deals closed. Simple. Effective. Each number directly connects to an action—if appointments drop, they prospect harder. If offers aren't converting, they sharpen their negotiation.
Then they hire their first assistant. Suddenly they need to track lead response times because someone else is handling initial contact. They add a "days on market" metric because they're juggling more listings. The legal pad becomes a spreadsheet.
By the time they've grown to five agents, they're drowning in metrics. Average commission per deal. Lead-to-appointment ratio by source. Agent productivity scores. Marketing ROI calculations. The dashboard that once triggered clear actions now just displays numbers. Lots of numbers.
What breaks isn't the data collection—it's the connection between measurement and action. When you're tracking 47 different KPIs across multiple agents, properties, and lead sources, how do you know which metric needs attention right now? More importantly, how does each metric translate into specific tasks or coaching moments?
Why agent-level metrics create organizational blindness
Walk into most 10-agent offices and you'll find individual performance dashboards everywhere. Agent A closed 8 deals this month. Agent B has a 23% conversion rate. Agent C averages $420,000 per sale.
Never miss a showing or follow-up again.
TryRealy helps you schedule, track, and manage every client interaction smoothly.
- Unified property and client management
- Automated client notifications
- Integrated sales pipeline tracking
No credit card required
These numbers feel important because they're easy to understand and compare. But they mask what's actually happening operationally.
Consider a mid-sized agency in Phoenix last year. Their top performer showed stellar individual metrics—highest close rate, shortest time to contract, largest average deal size. Management loved pointing to her numbers as the gold standard. Meanwhile, she was cherry-picking leads from the shared pool, only working referrals and repeat clients, and actively avoiding new development properties that required more work but generated crucial market presence for the agency.
The individual metrics looked fantastic. The organizational health was deteriorating.
The real insight comes from tracking interaction metrics—how work flows between agents, where handoffs fail, which combinations of agent expertise and client type produce results. An agent with a 15% conversion rate might be exactly who you want handling tough first-time buyers if they're successfully passing graduated clients to your luxury specialist who closes at 40%.
The minimum viable dashboard that actually works
Forget trying to build the perfect dashboard from day one. Start with five core metrics that directly trigger actions:
-
Pipeline velocity by stage. Not just how many leads or listings you have, but how fast they're moving through each stage. When velocity slows at "showing scheduled," you know exactly where to focus. When "offer submitted" to "under contract" stretches beyond 72 hours, you've identified a negotiation bottleneck.
-
Response time distribution. Not the average—the distribution. If 80% of inquiries get responses within an hour but 20% take over a day, those neglected leads are probably your highest-value ones getting lost in the shuffle. The action trigger: any inquiry over 4 hours old escalates to a senior agent.
-
Active inventory turnover. How long your current listings have been on market relative to area average. But segment by price range and property type. A luxury condo sitting for 90 days might be normal, while a starter home at 30 days signals a pricing or marketing problem.
-
Lead source efficiency ratio. Cost per lead divided by commission per closed deal, calculated monthly by source. When Zillow leads cost $200 each but generate $1,800 in commission, while Facebook leads cost $50 but yield $2,400, the action is clear. Just remember to factor in the time investment—those Facebook leads might require twice the nurturing.
-
Task completion rate by type. What percentage of scheduled follow-ups actually happen? How many listing presentations result in signed agreements? When follow-up completion drops below 70%, you need process enforcement. When listing conversion falls under 40%, you need presentation training.
Any inquiry over 4 hours old escalates to a senior agent.
Notice what's missing? Vanity metrics like total leads generated, website visitors, or social media followers. Those might matter for marketing reports, but they don't trigger operational actions.
Building the feedback loop between metrics and coaching
The biggest failure in real estate KPI tracking is treating metrics as a report card instead of a diagnostic tool. A dashboard showing an agent at 12% conversion doesn't tell you whether they need script training, better lead qualification, or just more confidence.
Tie each metric to specific intervention triggers.
When pipeline velocity slows at initial contact, don't just note it in the weekly meeting. Automatically trigger a 15-minute call review session. Pull three recorded conversations, identify where interest drops, and practice alternative approaches. The metric becomes the alarm, but the action is specific coaching.
When response times creep up, the intervention isn't "respond faster." It's examining the agent's daily schedule, identifying time blocks where inquiries pile up, and either adjusting their calendar or creating backup coverage during those windows.
For listing presentation conversion below 40%, the trigger isn't generic "sales training." It's a presentation audit. Review their materials. Sit in on their next presentation. Are they overwhelming clients with market data? Failing to address specific concerns? Not building enough rapport before diving into commission discussion? The metric identifies who needs help, but the intervention targets the specific breakdown.
This approach scales differently as you grow. A 3-agent team might have the broker personally review each triggered coaching opportunity. At 10 agents, team leads handle their assigned agents. At 30 agents, you need systematic triggers that automatically schedule coaching sessions and track whether those interventions actually move the metrics.
The 30-60-90 day implementation timeline
Rolling out a KPI-to-action dashboard isn't a weekend project. Here's what actually happens when agencies try to implement these systems:
| Phase | Summary |
|---|---|
| Days 1-30: Data reality check | Audit available data and clean what's needed for core metrics. |
| Days 31-60: Manual tracking with action triggers | Run metrics manually and generate specific tasks for triggered thresholds. |
| Days 61-90: Automation and expansion | Automate calculations and action-item generation while maintaining metric-action links. |
Days 1-30: Data reality check
Start by auditing what data you actually have versus what you think you have. Most agencies discover their CRM data is messier than expected. Lead sources are inconsistently tagged. Some agents log every interaction while others update nothing. Deal stages mean different things to different people.
Don't try to fix everything. Pick your five core metrics and clean just the data needed for those. If pipeline velocity is one of your metrics, standardize what triggers a move from "contacted" to "showing scheduled." Make it binary—either they've confirmed a specific showing time or they haven't.
Days 31-60: Manual tracking with action triggers
Before investing in dashboard software or complex integrations, run your system manually for a month. Every Monday, calculate your five metrics. Every metric that hits a trigger threshold generates a specific task.
This manual phase reveals what really matters. You might discover that response time distribution only matters for certain lead types. Or that pipeline velocity is more useful when calculated weekly rather than daily. Adjust your triggers based on what actually drives behavior change, not what seems logical on paper.
Days 61-90: Automation and expansion
Now you're ready to automate. Whether through your CRM, a business intelligence tool, or operational software designed for real estate, set up your dashboard to automatically calculate metrics and generate action items.
The key is maintaining the connection between metric and action. When pipeline velocity slows, the system shouldn't just show a red indicator—it should create a task for the responsible agent to review stuck deals with their team lead. When conversion rates drop, it should schedule coaching sessions, not just send alert emails everyone ignores.
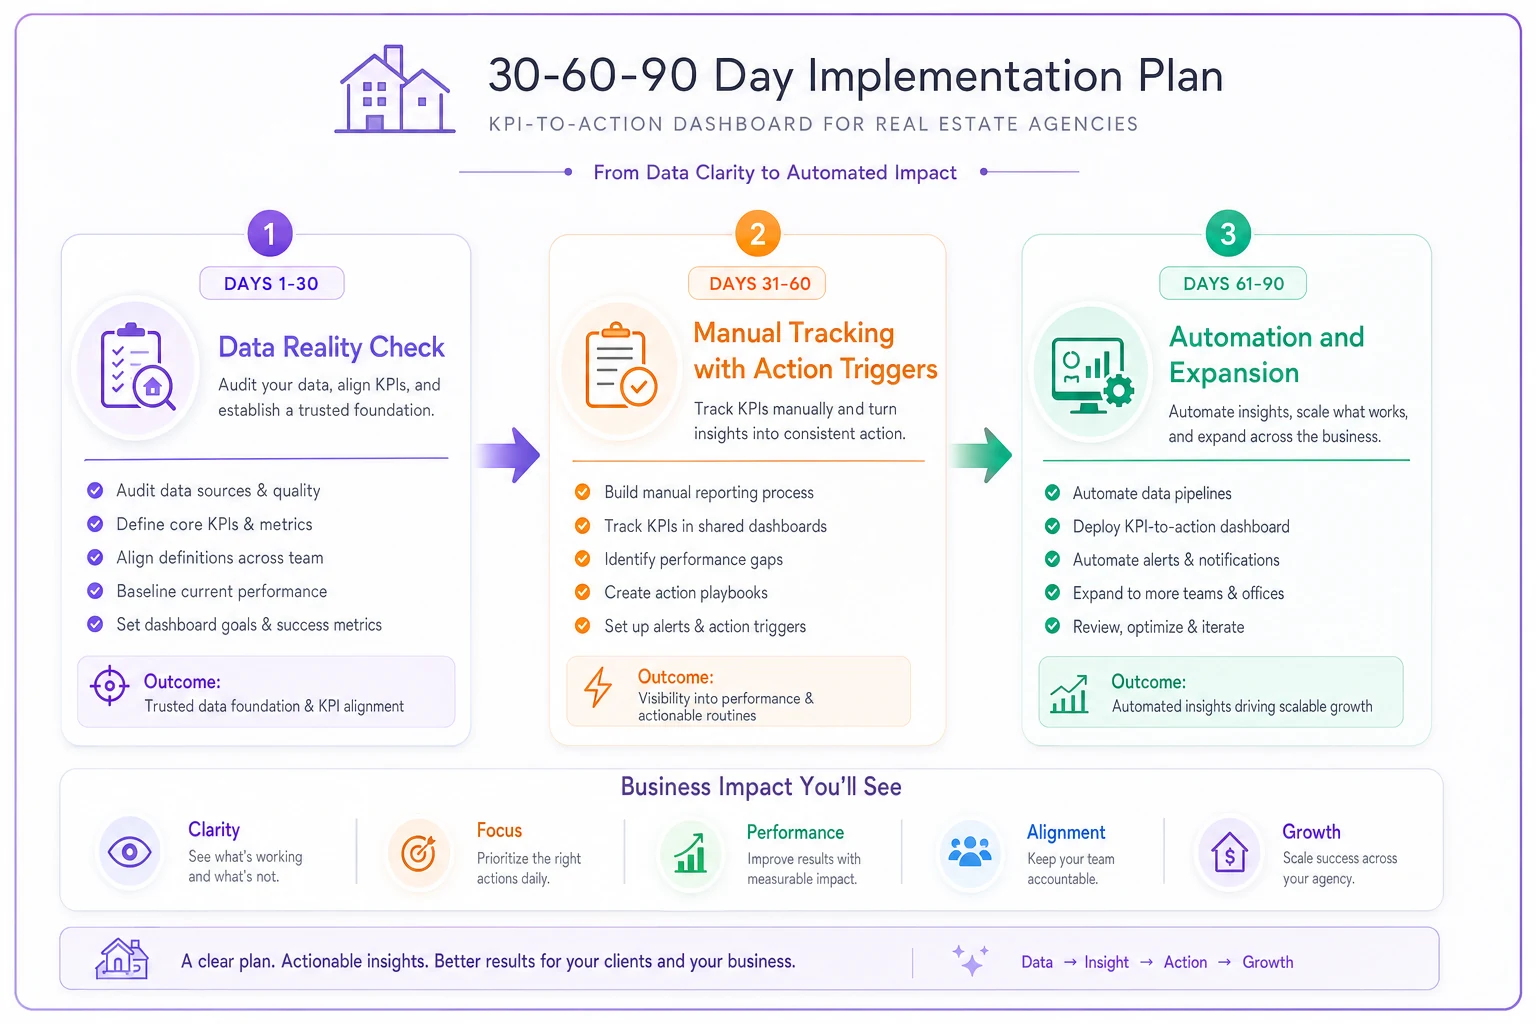
This visual lays out the steps so teams know what to do at each phase.
What changes at 10, 20, and 50 agents
The metrics that matter shift dramatically as agencies scale.
At 10 agents, individual performance still matters, but team dynamics become critical. You need to track collaboration metrics—how often agents refer clients to each other, share market intelligence, or team up on complex deals. A superstar agent who doesn't collaborate might boost short-term numbers while poisoning long-term culture.
At 20 agents, departmentalization begins. Your listing team operates differently from your buyer's agents. Your new construction specialists have different KPIs than your resale experts. The challenge isn't tracking more metrics—it's tracking the right metrics for each role while maintaining enough consistency to spot organizational patterns.
At 50 agents, you're running multiple businesses under one roof. The dashboard that worked at 20 agents now creates noise instead of clarity. You need exception-based reporting—only surface metrics that deviate from expected ranges. An agent at 15% conversion might be fine if they handle exclusively first-time buyers in a competitive market. But if their conversion suddenly drops from 20% to 15%, that's worth investigating.
The action triggers evolve too. At 10 agents, a conversion rate problem might trigger personal coaching. At 50 agents, it triggers a review of whether that agent is in the right role, working the right leads, or needs different support structure.
The hidden cost of dashboard complexity
There's a temptation, especially with modern analytics tools, to track everything because you can. One agency had invested in enterprise analytics software that tracked 400+ metrics updated in real-time. Their agents spent so much time interpreting dashboards that actual client work suffered.
The operational cost isn't just the software fees or setup time. It's the cognitive load on your team. Every metric you track is a decision point someone has to process. Every dashboard they check is time not spent with clients.
This is where AI automation actually helps—not by tracking more metrics, but by filtering what needs human attention. Instead of agents reviewing their pipeline every morning, the system identifies which specific deals need attention and why. Rather than managers scanning all performance metrics, they see only the triggered interventions requiring their input.
The goal isn't dashboard elimination—it's dashboard intelligence. Metrics should work like smoke detectors, silent until action is needed.
When metrics actively hurt performance
Sometimes the best decision is to stop tracking certain KPIs entirely. Agencies can improve performance by removing metrics, not adding them.
Average days on market is a classic example. Seems important, right? But tracking this across all agents often pushes them to pressure sellers into price reductions too quickly or to avoid taking on appropriately priced listings in slower-moving neighborhoods. The metric designed to improve efficiency actually reduces service quality and commission potential.
Lead conversion rate causes similar problems. Agents start cherry-picking easy converts while avoiding valuable but challenging clients. They mark legitimate leads as "unqualified" to protect their percentages. The metric meant to measure sales effectiveness instead incentivizes manipulation.
Call volume metrics are perhaps the worst offender. Agents make unnecessary calls, extend conversations artificially, or break single conversations into multiple touches. Meanwhile, agents who efficiently handle everything via text or email look unproductive despite happy clients and closed deals.
Before adding any metric to your dashboard, ask: What behavior will this incentivize? What gaming might occur? Is the benefit worth the potential distortion?
Building your action-first dashboard architecture
Instead of starting with metrics and hoping they drive behavior, start with the actions you want to trigger and work backwards to the metrics.
Want agents to respond faster to leads? Don't just track average response time. Track the percentage of leads responded to within your target window and automatically assign overflow to available agents. The metric becomes self-correcting.
Need better listing presentation conversion? Track it, but tie it directly to a library of proven presentation templates and automatic scheduling of practice sessions when conversion drops. The dashboard doesn't just identify problems—it initiates solutions.
Looking to improve client satisfaction? Instead of survey scores alone, track the ratio of repeat clients to total transactions. When it drops, trigger a review of recent transactions to identify where experience broke down. The metric connects to investigation, not just awareness.
This action-first approach fundamentally changes how dashboards function. They stop being reports and start being operation systems. The difference is whether your Monday morning meeting is spent discussing what the numbers mean or executing the actions those numbers triggered.
The dashboard that scales with you
The path from solo agent to major agency isn't just about adding agents—it's about evolving how you use metrics to drive operations. What starts as personal accountability becomes team coordination, then systematic optimization.
Your first dashboard might be three numbers on a whiteboard that tell you whether to prospect harder or follow up better. Your scaled dashboard might track dozens of metrics but only surface the five that need attention today, automatically assigning the corrective actions to the right people.
The constant through this evolution is the connection between metric and action. A number without a triggered response is just noise. A dashboard that doesn't drive behavior is just decoration. But when every KPI links directly to coaching, tasks, or process changes, metrics become the nervous system of your agency—sensing problems and initiating responses before those problems affect client experience or revenue.
The agencies that scale successfully don't necessarily track more metrics than those that struggle. They track metrics that matter, at the granularity that drives action, with triggers that ensure response. They build dashboards that work like operational software—turning data into decisions into tasks into results.
That's the difference between a real estate agency KPIs dashboard that looks impressive and one that actually improves performance. One tells you the score. The other tells you what to do next.
Ready to elevate your real estate business?
Join 2,000+ agencies using TryRealy to streamline operations, close deals faster, and deliver exceptional client experiences.