



The Conference Board's August reading came in at 89.4, down from 90.2, with the Expectations Index dropping to 68.2 — a number that historically signals people feeling shakier about their income and job prospects over the next six months. Reuters covered the release with the usual framing about weakening near-term buyer sentiment, and the full breakdown sits on the Conference Board's site if you want to dig into the components.
A 0.8-point dip doesn't move a single closing by itself. What it does is shift the behavior of people who were already on the fence — and in real estate, most of your active buyers are on the fence about something. The financing math, the neighborhood, whether they should just wait another month. A softer expectations number nudges those people toward "let's hold off," and that shows up in your operation as ghosted showings, slower offer decisions, and a longer gap between "interested" and "actually wrote an offer."
This post isn't really about the index. It's about the 30 days after a reading like this, and the specific operational adjustments that protect conversion and cash flow when your funnel gets a little colder. Treat confidence data as a leading indicator, not a headline.
What changes in your funnel when confidence slips
The mistake most teams make is assuming a demand dip hits everything evenly. It doesn't. A softening buyer pool distorts your funnel in uneven, pretty predictable ways:
-
- Top-of-funnel volume looks fine for a while. Portal leads keep coming because people still browse when they're nervous — browsing is free and low-commitment.
-
- Booking rates drop first. The gap between "inquired" and "actually showed up" widens. People who would've committed to a Saturday showing now say "let me check my schedule" and disappear.
-
- Offer velocity slows. Buyers who do tour take longer to decide, ask for more comps, want to think about it.
-
- Financing fragility increases. More of your pipeline is sitting at the edge of their approval, so any rate wobble or income worry knocks them out.
The danger isn't fewer leads. It's that the same lead count now converts worse, and your agents are burning the same hours chasing a pool that's quietly gotten softer. Cost-per-closing climbs and nobody can immediately point to why.
One thing worth naming: agencies that only track lead volume miss this shift entirely for a few weeks. Volume holds steady, everyone assumes the pipeline is healthy, and then next month's closing calendar looks thin. By then you've already lost the window to react.
The underlying problem this exposes
Most small agency operations are tuned for a market that behaves consistently. Your showing cadence, your follow-up timelines, your marketing spread across listings — all of it quietly assumes a lead today is worth about what a lead was worth last month. When sentiment softens, that assumption breaks, and the gaps show up in places you weren't measuring.
Never miss a showing or follow-up again.
TryRealy helps you schedule, track, and manage every client interaction smoothly.
- Unified property and client management
- Automated client notifications
- Integrated sales pipeline tracking
No credit card required
The core issue is lead and listing prioritization under uncertainty. When demand is strong, spreading attention evenly across listings and leads works fine — the market forgives sloppy triage. When demand tightens, that approach gets expensive. You end up giving a lukewarm browser the same follow-up energy as a pre-approved buyer with a 45-day timeline, and your best listings compete for the same marketing dollars as the ones that were always going to sit.
Tie the score to concrete SLA differences so the score changes what you do.
The response to a confidence dip isn't "work harder." It's "concentrate effort where probability is highest." That means scoring your listings and leads by likelihood-to-close, then biasing your time, your confirmations, and your ad dollars toward the top of that list.
The 30-day checklist
This is front-loaded on purpose. The first ten days matter most because that's when you're still ahead of the demand curve.
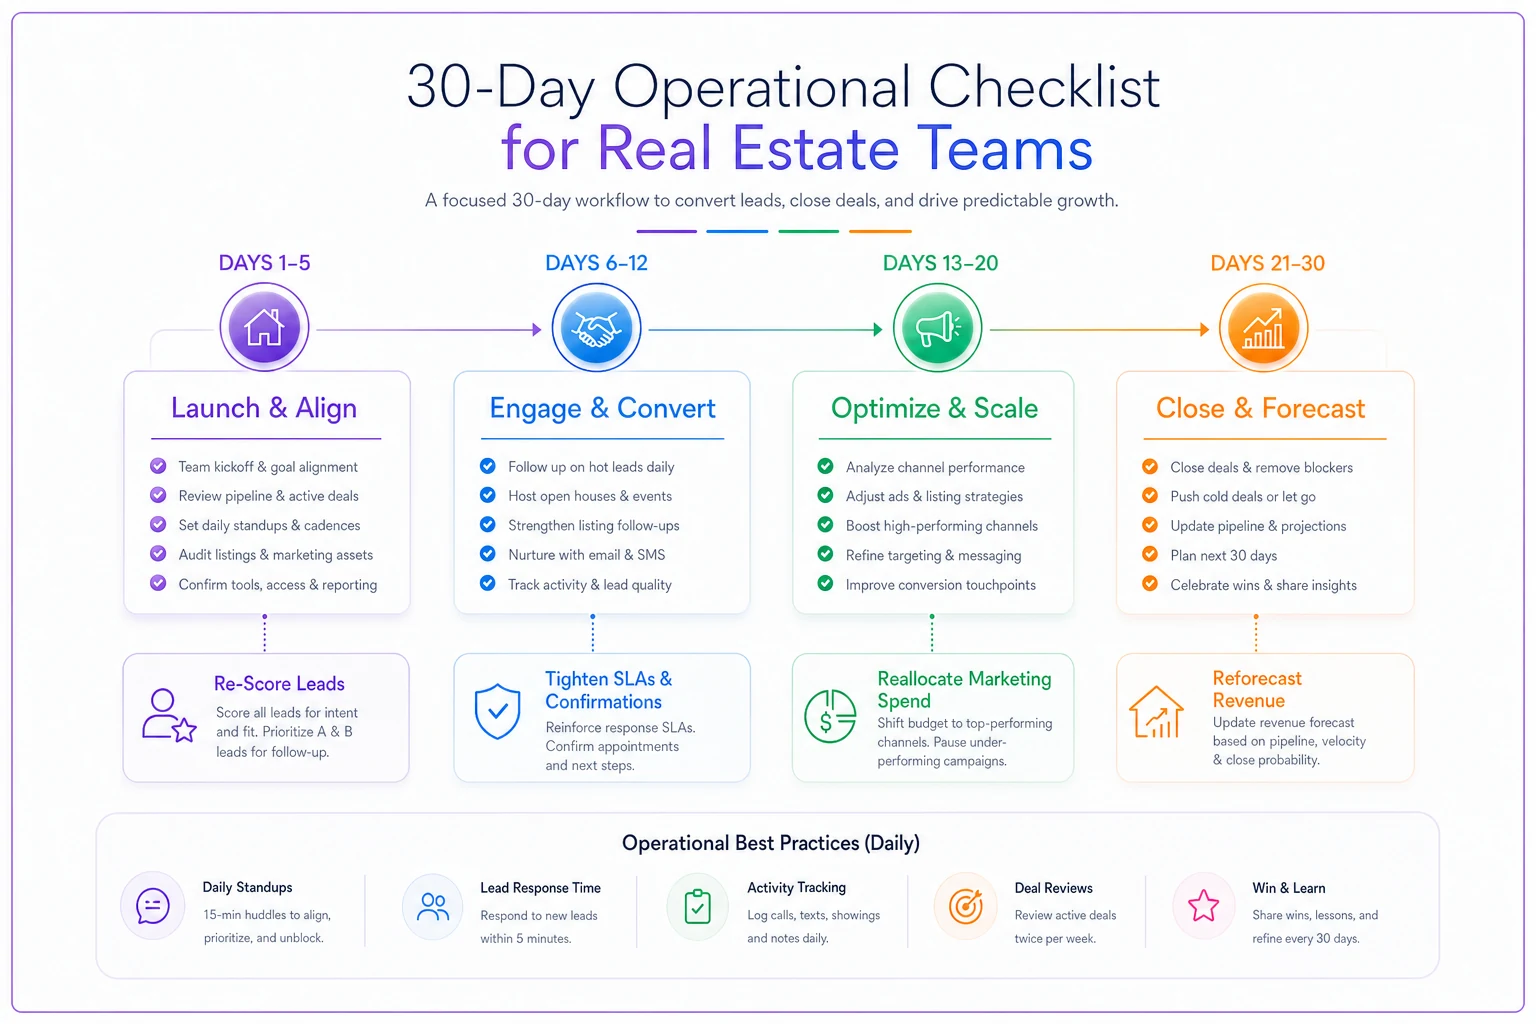
A simple visual of the timeline helps teams see where to focus effort each week.
Days 1–5: Re-score and re-triage
-
- [ ] Re-score every active lead by intent and financing status. Three tiers: pre-approved with a sub-60-day timeline (A), interested but financing unconfirmed (B), browsing with no timeline (C).
-
- [ ] Flag every listing by momentum. Which have showing activity, which are stalling, which are new. Stalling listings need a decision this week.
-
- [ ] Pull your no-show rate from the last 30 days and write it down. You'll track this number closely going forward.
-
- [ ] Identify the 3–5 listings driving most of your realistic near-term revenue. Those get protected first.
Days 6–12: Tighten showing and follow-up SLAs
-
- [ ] Shorten the booking-to-showing window on A-tier leads. Momentum decays fast when sentiment is soft — a buyer excited today can be lukewarm by Wednesday.
-
- [ ] Add a confirmation touch the morning of every showing. Softer buyers ghost more. A light reminder recovers a meaningful chunk of them.
-
- [ ] Reroute B-tier leads to a nurture cadence instead of burning prime agent hours on them right now.
-
- [ ] Set a same-day response SLA on A-tier inquiries. Speed matters more when the margin for a lead cooling off is smaller.
Days 13–20: Reallocate marketing spend
-
- [ ] Pull budget off C-tier and stalling listings. Put it behind the listings with real momentum and realistic pricing.
-
- [ ] Refresh creative on your top 3–5 listings rather than launching new campaigns everywhere at once.
-
- [ ] Audit which lead sources produced your A-tier leads last quarter and weight spend toward those.
Days 21–30: Reforecast and set temporary rules
-
- [ ] Rebuild your 60-day revenue forecast using softer conversion assumptions, not last quarter's numbers.
-
- [ ] Set a temporary priority rule so agents know explicitly that A-tier leads and protected listings come first.
-
- [ ] Have the pricing conversation on stalling listings now. Avoiding it costs more in 30 days.
-
- [ ] Recheck your no-show baseline and see if the morning confirmations actually moved it.
The first two weeks are where you can most influence outcomes; the last two are about locking in those prioritizations and updating forecasts.
How to score listings and leads without overthinking it
The scoring doesn't need to be complicated. Overbuilt models fall apart within a week because nobody maintains them. What works is a lightweight rubric your team can apply in under a minute.
For leads, three signals carry most of the weight:
| Signal | A (high) | B (medium) | C (low) |
|---|---|---|---|
| Financing status | Pre-approved | In process | None / unknown |
| Timeline | Under 60 days | 60–120 days | No timeline |
| Engagement | Booked or attended showing | Replied, no booking | Cold / one-touch |
An A across all three gets your fastest response and your best agent. A C across the board gets automated nurture until something changes. Not complicated — the discipline of actually sorting is what most teams skip.
For listings, the logic mirrors it: showing activity, pricing realism relative to comps, and days-on-market trend. High-scoring listings get the protected budget and the tightened SLAs. For a more complete framework — the actual ROI scoring model with SLA tiers built for small teams — the prioritize listings and marketing budget playbook covers exactly that and pairs well with the triage work above.
The thing people miss: scoring only matters if it changes what you do. Plenty of agencies score leads and then treat them all the same anyway. The score has to be tied to a concrete SLA difference, or it's just busywork.
How this plays out for a real small team
Take a six-agent agency doing somewhere around 8–10 closings a month in a mid-sized market. Coming into a soft stretch, their portal lead volume held steady — roughly the same 120-ish leads a month they'd been seeing. Everyone assumed the pipeline was fine.
But their no-show rate crept from around 18% to somewhere near 28% over three weeks, and offers were taking noticeably longer to come in. The lead pool hadn't shrunk — it had gotten colder, and nobody caught it because they were watching volume instead of conversion rate.
Once they re-triaged, it got obvious. Roughly a third of their "active" leads were C-tier browsers eating real agent hours. They moved those into a nurture track, added a morning-of confirmation to every showing, and tightened their A-tier response time to same-day. The no-show rate settled back toward the low 20s within a couple weeks, and — more importantly — agents were spending their hours on leads that could actually close this quarter.
Revenue didn't jump. That's not what happened. They held their closing count through a soft stretch instead of watching next month's calendar quietly thin out. In a demand dip, holding steady is the win.
When aggressive triage makes sense — and when it doesn't
It makes sense when your pipeline has a real probability spread — some clearly hot leads, some clearly cold, and limited agent hours. That's most agencies in a softening market. Triage buys leverage exactly when you need it.
It becomes a problem when you overreact to a single data point and start ignoring your B-tier entirely. A confidence dip is a nudge, not a collapse. B-tier leads still close — they just take longer. Cut them off completely and you're mortgaging next quarter to protect this one.
It probably doesn't apply if you're a solo agent or a two-person team with 15–20 leads a month. At that volume, you don't have a prioritization problem. You have a volume problem, and adding a triage layer just creates overhead without much upside.
The broader point: a confidence reading is a signal to sharpen your operation, not panic. The agencies that get hurt in soft markets are either running on steady-demand assumptions they never questioned, or they overcorrect into a defensive crouch and stop operating aggressively on their best opportunities. Re-triage, protect what's worth protecting, reforecast honestly, and keep moving.
Bottom line for the next 30 days
Watch conversion, not just volume. A demand dip hides inside a healthy-looking lead count, and the first symptom is almost always a rising no-show rate and slower offers — not fewer inquiries. Re-score your leads and listings this week, tie those scores to real SLA differences, concentrate marketing behind listings with momentum, and reforecast with softer assumptions instead of last quarter's numbers.
None of this requires new technology or a strong market call. It requires triage discipline and the willingness to treat a confidence reading as an early warning you actually act on — while you're still ahead of the curve, not scrambling once the closing calendar looks thin.
None of this requires new technology or a strong market call. It requires triage discipline and the willingness to treat a confidence reading as an early warning you actually act on — while you're still ahead of the curve, not scrambling once the closing calendar looks thin.
Ready to elevate your real estate business?
Join 2,000+ agencies using TryRealy to streamline operations, close deals faster, and deliver exceptional client experiences.