



Most small agencies don't fail because they lack talent. They fail because the four core parts of the business — listings, lead operations, marketing, and finance — run as four separate kingdoms that barely talk to each other. Listings has a whiteboard. Lead ops lives in the CRM. Marketing runs off a spreadsheet and gut feel. Finance is a shoebox that gets opened at tax time. Each one works fine on its own. The problem is that the decisions one makes silently reshape the others, and nobody's watching the seams.
An agency operating model for real estate isn't an org chart or a mission statement. It's the plumbing: what inputs feed each function, what decisions those functions are allowed to make, what outputs they hand downstream, and how the whole thing gets reviewed on a regular cadence so signals turn into action instead of just noise on a dashboard. That last part is where almost everyone drops the ball. You can have great numbers and still make zero decisions because nobody owns the loop that converts a KPI into a budget cut, a new hire, or a backlog item.
This is the pillar piece. It's less about any single workflow and more about how the workflows lock together — and what starts to snap when you grow from three agents to fifteen.
The map: inputs → decisions → outputs
Before you can govern anything, you have to see the flow honestly. Here's how the four functions actually chain together in a working agency. Notice how the output of one becomes the input of the next — that's the whole point.
| Function | Key inputs | Decisions it owns | Outputs it hands downstream |
|---|---|---|---|
| Marketing | Budget allocation, lead-source performance, neighborhood demand signals | Channel mix, spend per source, which listings get boosted | Raw leads + attribution tags → Lead Ops |
| Lead Ops | Incoming leads, SLA tiers, agent capacity | Routing, follow-up cadence, disqualification | Qualified appointments + conversion data → Listings & Finance |
| Listings | Signed sellers, prep timelines, vendor availability | Pricing prep, launch sequencing, creative scope | Active inventory + days-on-market data → Marketing & Finance |
| Finance | Closings, commission splits, spend across all functions | Budget reallocation, hiring triggers, comp adjustments | Budget envelopes + margin signals → Marketing & Ops |
The failure most agencies never diagnose: these handoffs happen implicitly. Marketing spends money without knowing lead ops is already at capacity. Lead ops books appointments for a price point listings can't source inventory in. Finance approves a hire based on last quarter's closings without knowing marketing quietly killed the source that fed those closings. Every one of those is a coordination failure, not a competence failure.
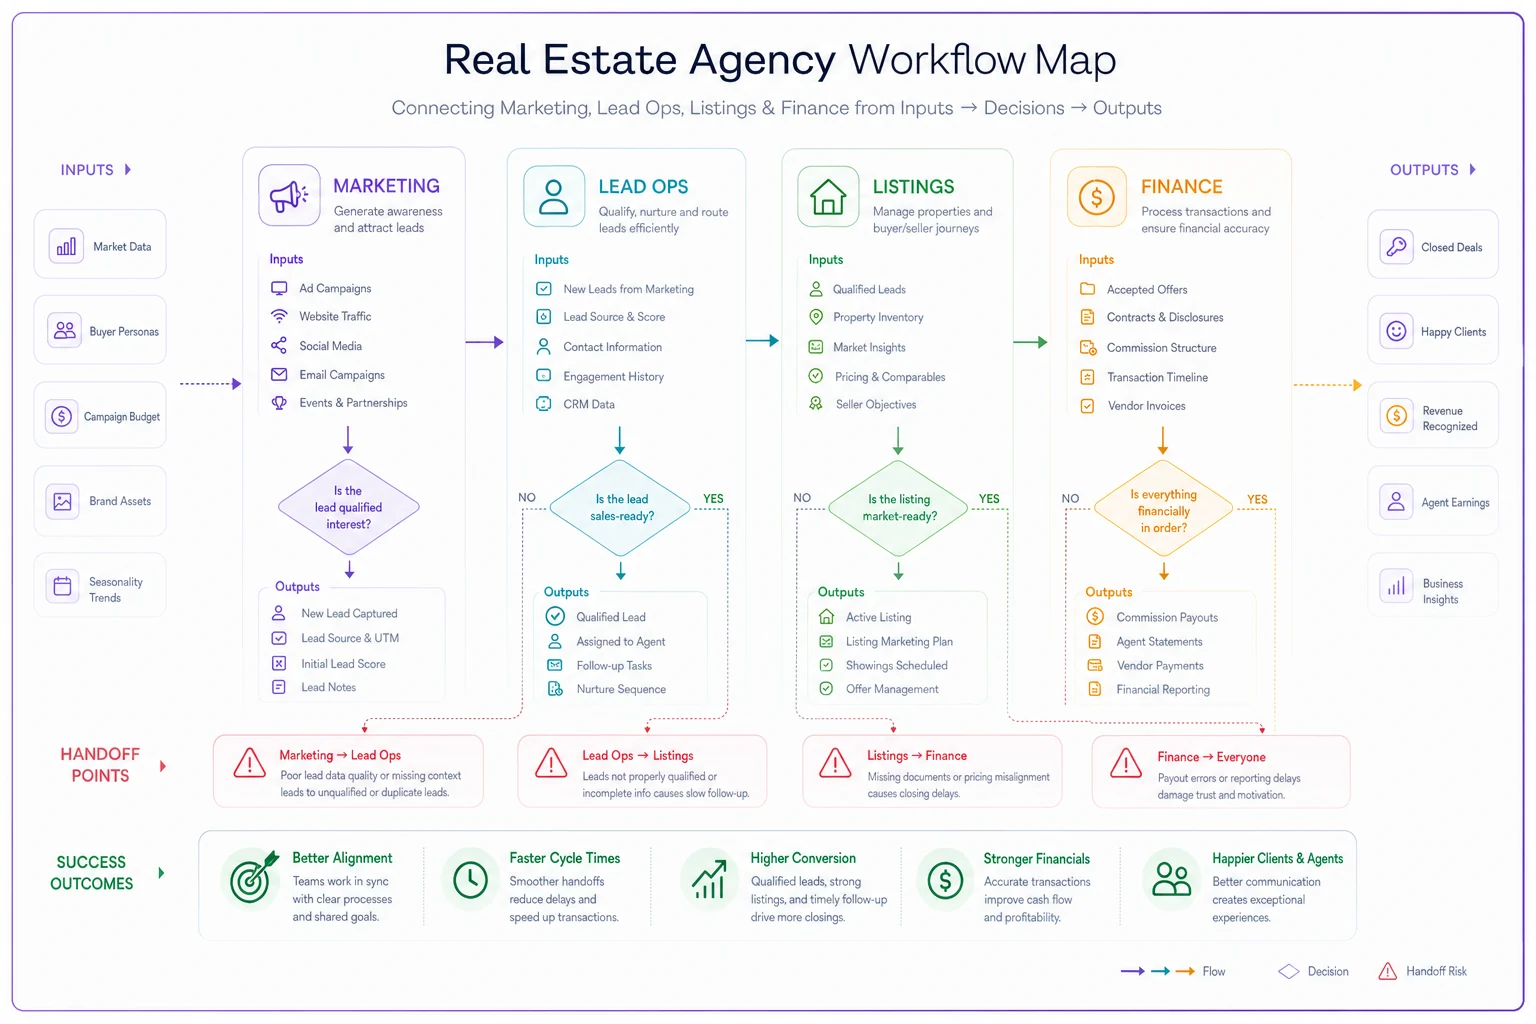
This sketch shows how each function's output feeds the next and where handoffs commonly fail.
A useful gut-check: for any decision your agency makes this week, can you name the input that triggered it and the output it produces? If the honest answer is "someone just decided," you've found a gap in the model.
Where it breaks at scale
At three agents, informal coordination works. The owner sees everything. Somebody says "we're slammed" in the group chat and marketing eases off. That verbal nervous system is invisible but real, and it's holding the whole thing together.
Never miss a showing or follow-up again.
TryRealy helps you schedule, track, and manage every client interaction smoothly.
- Unified property and client management
- Automated client notifications
- Integrated sales pipeline tracking
No credit card required
Then you hit somewhere around eight to twelve agents and it quietly stops working. The pattern is pretty consistent:
-
Lead leakage becomes structural, not occasional. With three agents, a dropped lead is an embarrassing exception. With twelve, nobody even knows how many leaked because there's no single owner watching the SLA across sources.
-
Marketing spend outruns operational capacity. The team gets better at generating leads faster than it gets better at working them. You end up paying for leads that die in the queue — literally buying future no-shows.
-
Finance lags reality by 30–60 days. Decisions get made on stale closings. By the time the P&L shows a problem, the source that caused it has been misfiring for two months.
-
Listings prep quality drifts. More volume, same coordinators, and the 48-hour prep standard slips to five days without anyone deciding it should.
The root cause is always the same: the informal coordination that worked at small scale never got replaced with an explicit governance loop. Growth doesn't break the functions — it breaks the connective tissue between them. And connective tissue is exactly what nobody budgets time to build.
If you want the longer arc of how this maturity progresses stage by stage, the 12-month operations maturity roadmap for small agencies walks through what to fix and in what order — this article assumes you're ready to wire the functions together.
Decision tables: making the model executable
A map tells you how things connect. A decision table tells people what to do when a number moves. This is where the operating model becomes real work instead of a diagram.
The trick is attaching every meaningful KPI to a threshold and a pre-agreed action. Not "let's discuss it" — an action. Here's a lead-ops decision table as an example of the format:
| Signal | Green | Yellow | Red | Owner action on Red |
|---|---|---|---|---|
| Lead-to-appointment rate | >22% | 15–22% | <15% | Audit routing + cadence within the source; pull spend if source-specific |
| Speed-to-first-contact | <5 min | 5–30 min | >30 min | Reassign after-hours coverage; escalate to team lead |
| Appointment-to-showing | >70% | 55–70% | <55% | Review confirmation cadence; check qualification quality |
| Cost per booked appointment | <$45 | $45–$80 | >$80 | Finance flags source for the monthly governance review |
Two things make this work that most agencies miss.
First, thresholds are per-source, not blended. A blended 18% lead-to-appointment rate can hide one source running at 30% and another running at 6%. The blend tells you nothing about what to change. This is exactly the trap covered in which real-estate KPIs mislead small agencies — a healthy-looking average masking two very different realities underneath it.
Second, the "red" action names an owner. A threshold with no owner is a fact, not a decision. If cost-per-appointment goes red and nobody is required to act, it will stay red for a quarter.
You'd build parallel tables for each function — listings (days-on-market vs. list price, prep-cycle time), marketing (ROAS per channel, cost per lead by source), and finance (gross margin per closing, spend-to-revenue ratio). The ROI scoring model for prioritizing listings and marketing budget is a good companion for setting the listings and marketing thresholds specifically.
Hiring triggers, made explicit
-
Lead ops coordinator speed-to-first-contact stays yellow/red for two consecutive months and lead volume per coordinator is above your defined ceiling.
-
Listing coordinator prep-cycle time slips past your standard for 60% of listings across two months.
-
New agent qualified appointments consistently exceed current agent capacity, and lead-to-appointment is healthy — you're losing on capacity, not conversion.
The point isn't these exact numbers. It's that the trigger exists before you're desperate. Agencies that hire in a panic almost always hire the wrong role.
The monthly governance loop
This is the piece that separates agencies that have dashboards from agencies that use them. A dashboard is a rear-view mirror. A governance loop is the steering wheel. The loop is the monthly ritual that converts KPI signals into three specific outputs: backlog items, budget moves, and hiring actions.
-
Pull the scorecard. Every function's KPIs against thresholds. Reds and yellows only get discussed — greens are noted and skipped. Don't spend meeting time celebrating green.
-
Trace each red to a root cause. Was the cost-per-appointment red because the source degraded, or because lead ops was at capacity and worked leads slower? Same symptom, opposite fixes.
-
Assign each red to exactly one of three buckets - Backlog — a process fix (rewrite the confirmation cadence, add a routing rule) - Budget — reallocate spend away from a failing source toward a winning one - Hiring — a capacity trigger has been crossed (more on triggers below)
-
Set the budget envelope for next month. Marketing doesn't get to spend into a channel that's been red two months running without a defended reason.
-
Check hiring triggers explicitly. Don't hire on vibes. Hire when a pre-agreed capacity metric crosses its line.
-
Record the decisions and their owners. Next month starts by checking whether last month's decisions moved the number. If they didn't, that's the first agenda item.
The value is in step 3. Most agency meetings identify problems and then nothing happens. Everyone nods, the meeting ends, and the same red shows up next month. Forcing every red into backlog / budget / hiring means every problem leaves the room attached to an action and an owner.
Sample governance cadence templates
The monthly loop doesn't stand alone. It sits inside a rhythm of shorter and longer cycles. Here's a cadence skeleton that works for most small agencies:
Weekly (15–20 min, per function):
-
Reds/yellows only against thresholds
-
Any SLA breach in the last 7 days
-
One question
"anything trending toward red we can catch early?"
Monthly (60–90 min, cross-function):
-
Full scorecard review
-
Root-cause every red
-
Assign to backlog / budget / hiring
-
Set next month's budget envelope
-
Review prior month's decisions — did they work?
Quarterly (half-day):
-
Threshold recalibration (are your green/yellow/red lines still right?)
-
Channel mix review across the full quarter
-
Capacity planning and hiring pipeline
-
Comp and incentive check against the model
Annual:
-
Rebuild the inputs → decisions → outputs map from scratch
-
Kill functions or reports nobody used
-
Reset the whole threshold set for the coming year
The most common mistake is skipping the quarterly threshold recalibration. Thresholds drift out of relevance as the market moves. A cost-per-appointment ceiling of $45 that made sense in a hot market becomes a straitjacket when the market cools and every source gets more expensive. Governance without recalibration slowly turns into governance against reality.
Where the software layer actually helps
None of this requires special tools to start. You can run the first version on a spreadsheet and a recurring calendar block. But it falls apart at scale for a boring reason: the data lives in four places and pulling the scorecard by hand takes so long that the monthly loop quietly dies.
This is the practical case for a workflow platform that centralizes the four functions — where listings status, lead SLAs, marketing spend by source, and closing data all live in one place instead of four disconnected tools. When the scorecard assembles itself, the monthly loop stays a 60-minute decision session instead of a two-day data-gathering exercise. AI automation earns its keep in the unglamorous middle: watching thresholds continuously, flagging a source going red before the monthly meeting, and tagging attribution so lead sources trace cleanly. The goal isn't to automate the decision — it's to make sure a human is looking at the right decision at the right time, with clean numbers underneath it.
The distinction matters: software doesn't run your operating model. It removes the friction that makes agencies abandon their operating model by month three.
A real scenario
A seven-agent brokerage was spending roughly $6k–$7k a month on lead generation across three portals plus some local social. Closings were fine, so nobody looked hard. When they built a proper scorecard for the first time, the blended lead-to-appointment rate looked acceptable at around 17%.
Split by source, the story changed. One portal was converting near 26%. Another was sitting around 6% and eating close to $2.5k a month — leads were coming in, but at a price point their agents couldn't source inventory for, so almost every one died in the queue. It had been leaking money for at least two quarters because the blended number hid it and nobody owned the source-level view.
The fix wasn't dramatic. In the first monthly loop, that red source got flagged, root-caused (wrong price band, not a lead-quality problem), and moved to the budget bucket — spend redirected to the source already converting. Within about two months, booked appointments per dollar improved noticeably and they redeployed roughly $2k monthly without adding a cent to the total budget. No new hires, no heroics. Just the loop catching what four separate kingdoms couldn't see.
When this makes sense — and when it doesn't
Build this out when: you're past four or five agents, you feel busy but can't clearly say where the money leaks, and decisions are getting made by whoever spoke loudest last. If problems recur month after month, you have a governance gap, not a talent gap.
Hold off when: you're two or three people and the verbal nervous system genuinely still works. Formalizing too early is its own failure mode — you'll spend time maintaining a model that's heavier than the business it governs. A lightweight weekly check on a handful of numbers is plenty at that size.
Be careful if: you're tempted to build the full cadence but you know you won't hold the monthly meeting. A governance loop that gets skipped is worse than none — it creates the illusion of control while the same reds pile up. The discipline of actually running the loop matters more than the sophistication of the tables.
Bringing it together
The agencies that scale cleanly aren't the ones with the best individual functions. They're the ones where listings, lead ops, marketing, and finance are wired into a single loop that turns signals into decisions on a predictable rhythm. Everything upstream — your thresholds, your decision tables, your attribution — only matters if there's a standing appointment where someone is required to act on what the numbers say.
Start smaller than you think. Map the four functions and their handoffs. Attach thresholds and owners to a handful of KPIs per function. Then protect one 90-minute monthly meeting where reds become backlog, budget, or hiring actions — nothing more. That single discipline, held for a few months, does more than any dashboard ever will. The model isn't the diagram. It's the loop that keeps running whether or not anyone's watching the whiteboard.
The agencies that scale cleanly aren't the ones with the best individual functions. They're the ones where listings, lead ops, marketing, and finance are wired into a single loop that turns signals into decisions on a predictable rhythm. Everything upstream — your thresholds, your decision tables, your attribution — only matters if there's a standing appointment where someone is required to act on what the numbers say.
Start smaller than you think. Map the four functions and their handoffs. Attach thresholds and owners to a handful of KPIs per function. Then protect one 90-minute monthly meeting where reds become backlog, budget, or hiring actions — nothing more. That single discipline, held for a few months, does more than any dashboard ever will. The model isn't the diagram. It's the loop that keeps running whether or not anyone's watching the whiteboard.
Ready to elevate your real estate business?
Join 2,000+ agencies using TryRealy to streamline operations, close deals faster, and deliver exceptional client experiences.