



Most small agencies forecast revenue the same way people guess how much gas they have left: a glance at the dashboard, a bad feeling, and a hope they make it. Then a "sure thing" closing falls through in week three, two deals that looked dead suddenly close, and the number you told your accountant last month is off by 40%. Nobody's lying. The forecasting method is just too coarse for how fast a real estate pipeline actually moves.
Residential deals live in a strange middle zone. They're too long to forecast weekly like a retail shop, but too short and volatile to forecast quarterly like enterprise sales. A lead that walked into an open house on Saturday might close in 18 days or 180. And commission — the number that actually pays your agents and your rent — sits at the very end of a chain of conversion steps that each have their own failure rate.
Short-cycle forecasting fixes this by doing something simple but disciplined: you attach a probability to every stage of the pipeline, refresh it weekly, and roll the whole thing forward 90 days on a repeating cycle. That's the whole system. The rest of this is how to build it so it survives contact with a real agency.
Why annual and gut-feel forecasts break for agencies
The math that ruins agency forecasts is usually hidden inside a single word: "pipeline." When an agent tells you they have "$180k in the pipeline," they're almost always quoting gross potential — the full commission if every deal closes. That number is fiction. It treats a lead who hasn't returned a call the same as a buyer who's already in attorney review.
-
Stage inflation. Agents move leads forward emotionally, not operationally. A good phone call feels like progress, so a lead jumps from "new" to "hot" without any real commitment.
-
No decay on stale deals. A deal that entered "negotiating" six weeks ago is still sitting there at 80% probability, even though the seller went cold. Nothing ages it down.
-
Timing blindness. Even correctly-rated deals get counted in the wrong month. A closing "expected soon" slides two weeks and blows up the period it was supposed to land in.
Each of these gets worse as you add agents. With two producers, you can hold the real state of every deal in your head. At six or eight, you can't — and the forecast becomes a pile of individually optimistic guesses stacked on top of each other. It's the same underlying issue that shows up when agencies track KPIs that quietly mislead them: the raw number looks authoritative, but it isn't connected to how deals actually behave.
The four inputs that make a forecast trustworthy
1. Lead → stage mapping
Never miss a showing or follow-up again.
TryRealy helps you schedule, track, and manage every client interaction smoothly.
- Unified property and client management
- Automated client notifications
- Integrated sales pipeline tracking
No credit card required
The first fix is refusing to let stages be vibes. Every stage needs an entry condition — a concrete, observable thing that has to be true before a lead advances. If you can't point to the artifact (a signed agreement, a scheduled inspection, an accepted offer), the lead doesn't move.
| Stage | Entry condition (must be true) | Typical time in stage |
|---|---|---|
| New Lead | Contact captured, not yet qualified | 0–3 days |
| Qualified | Two-way conversation + budget/timeline confirmed | 3–10 days |
| Active (Showing/Listing prep) | Buyer touring or listing agreement signed | 1–5 weeks |
| Offer / Negotiation | Written offer submitted or received | 3–14 days |
| Under Contract | Accepted offer, inspection period open | 2–5 weeks |
| Clear to Close | Financing cleared, contingencies removed | 3–10 days |
Notice there's no "hot" or "warm." Those words feel useful but mean different things to different agents, and they're the number one source of stage inflation. Replace subjective heat with objective entry conditions and half your forecasting noise disappears.
2. Confidence multipliers
Each stage gets a multiplier — the historical probability that a deal at that stage actually closes. This is where your forecast stops being a wish. You multiply the gross commission of every deal by its stage multiplier, and the sum is your confidence-adjusted forecast.
| Stage | Confidence multiplier |
|---|---|
| New Lead | 0.05 |
| Qualified | 0.15 |
| Active | 0.30 |
| Offer / Negotiation | 0.50 |
| Under Contract | 0.80 |
| Clear to Close | 0.95 |
Two rules keep these honest. First, apply a decay — if a deal sits in a stage past its typical time-in-stage without moving, knock its multiplier down a tier. A deal stuck in "Offer" for three weeks isn't a 0.50 anymore; it's behaving like a 0.30. Second, recalibrate quarterly. Multipliers drift with the market. In a fast market your "Active" stage might convert at 0.40; when rates jump it can fall to 0.20 and drag your whole forecast with it.
3. Sample commission math
Here's what this looks like with a small team's actual snapshot:
-
12 New Leads, avg commission ~$8,000 each → 12 × $8,000 × 0.05 = $4,800
-
6 Qualified, avg ~$8,500 → 6 × $8,500 × 0.15 = $7,650
-
5 Active, avg ~$9,000 → 5 × $9,000 × 0.30 = $13,500
-
3 in Offer, avg ~$9,500 → 3 × $9,500 × 0.50 = $14,250
-
2 Under Contract, avg ~$10,000 → 2 × $10,000 × 0.80 = $16,000
-
1 Clear to Close, ~$9,000 → 1 × $9,000 × 0.95 = $8,550
Gross potential across all of that is roughly $270k. Your confidence-adjusted forecast is about $64,750. That second number is the one you plan against. The gap between $270k and $64.7k is the fantasy that sinks agencies who staff off "pipeline."
The useful insight isn't the total — it's where the money concentrates. A huge share of the realistic forecast comes from a handful of late-stage deals. Twelve new leads contribute less confidence-adjusted revenue than two deals under contract. That tells you where your protection effort belongs: losing one under-contract deal hurts more than losing five new leads.
The weekly checkpoint
A forecast that only updates monthly is already lying by week two. The whole point of "short-cycle" is a weekly checkpoint — a 20-minute review where every live deal gets three questions asked of it:
-
Did it change stage this week? (advance, hold, or drop)
-
Did it exceed its time-in-stage limit? (if yes, apply decay)
-
Did the expected close date move? (if yes, which forecast period does it land in now)
That's it. You're not re-litigating strategy. You're keeping the numbers honest.
Here's a simple weekly checkpoint sheet layout:
| Deal | Current stage | Weeks in stage | Multiplier | Gross comm | Adj. comm | Close month | Change vs last week |
|---|---|---|---|---|---|---|---|
| 14 Oak St | Under Contract | 2 | 0.80 | $10,000 | $8,000 | This month | — |
| Buyer: Reyes | Active | 6 ⚠️ | 0.20 (decayed) | $9,000 | $1,800 | +60 days | Decayed from 0.30 |
| 88 Pine Ave | Offer | 1 | 0.50 | $9,500 | $4,750 | Next month | New this week |
The "change vs last week" column is the one owners ignore and shouldn't. A forecast that swings $15k week over week isn't necessarily wrong — but it tells you which deals are volatile, and volatile deals are where your attention pays off. When you run these checkpoints alongside your agent performance conversations, a pattern often emerges: some agents' deals decay constantly, which usually points to a follow-up gap, not bad luck.
Keep the weekly checkpoint to 20 minutes and focus only on the three questions to avoid turning it into a coaching session.
One thing worth flagging: don't let the weekly checkpoint turn into a coaching session. The second it does, agents start gaming their stages so the review goes smoothly. Keep forecasting and performance management in separate meetings even if the same data feeds both.
The 90-day rolling reforecast
Weekly checkpoints keep the current number honest. The 90-day rolling reforecast turns forecasting into a decision tool instead of a reporting exercise.
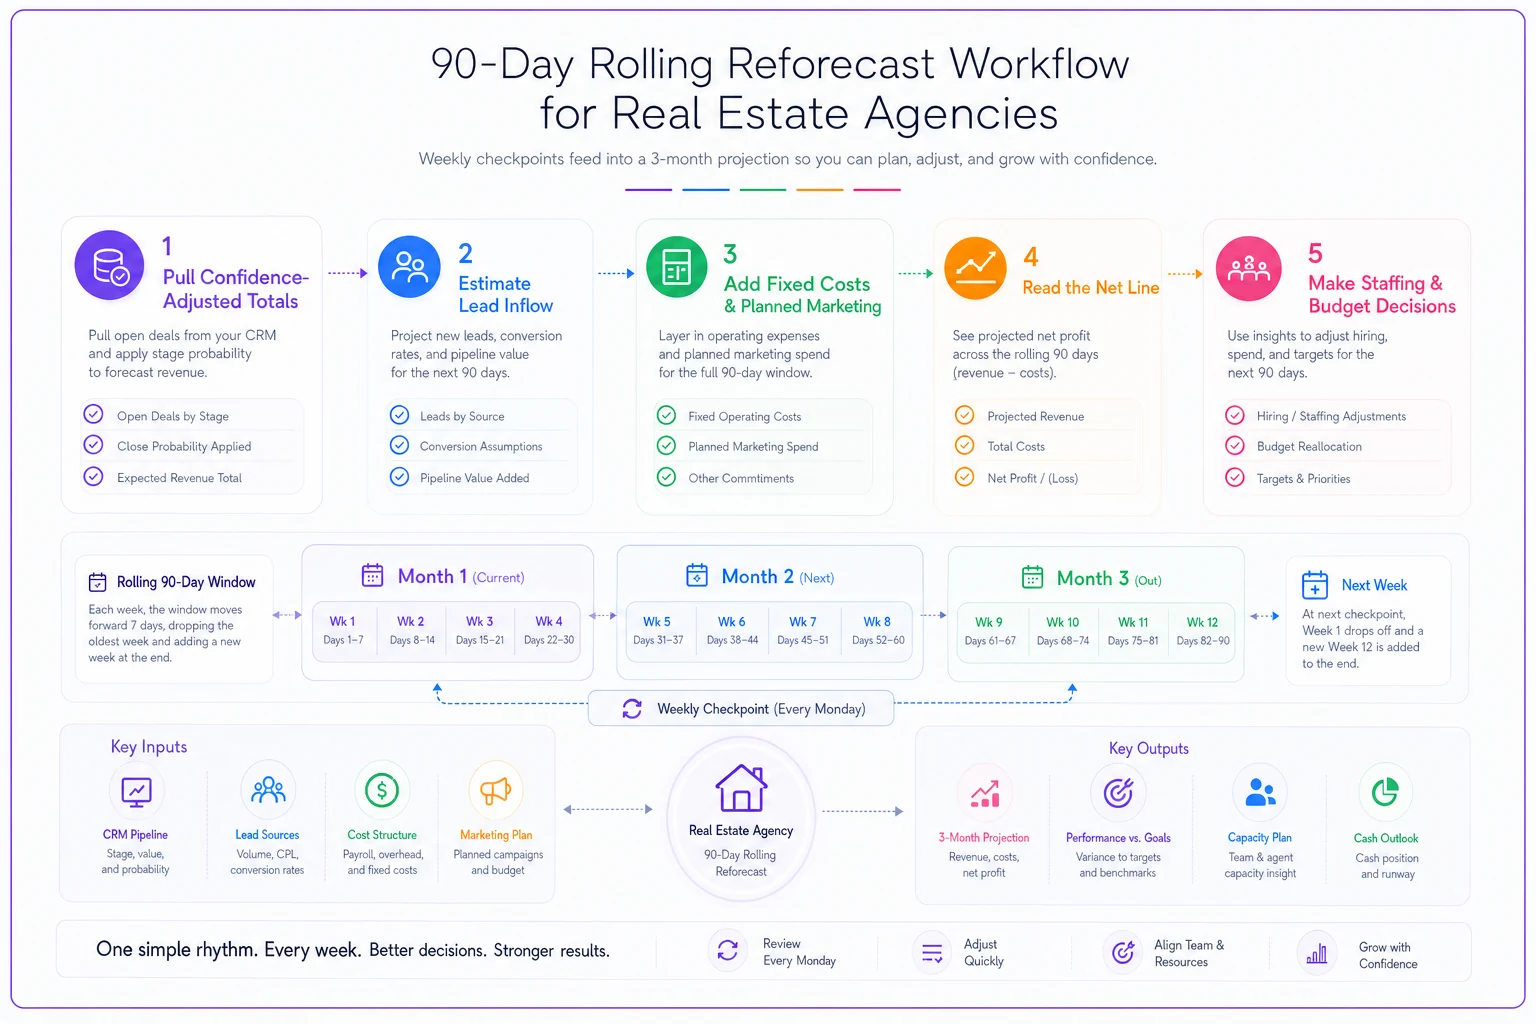
Every 30 days, you rebuild a rolling three-month projection — month 1, month 2, month 3 — using confidence-adjusted numbers plus expected new lead inflow. Then you shift the window forward. Month 1 drops off, a new month 3 gets added. You're always looking exactly 90 days out.
The process runs in four steps each cycle:
-
Pull confidence-adjusted totals for all live deals and sort them by expected close month.
-
Estimate inflow commission from leads you expect to generate over the next 60–90 days, based on your historical lead-to-close rates by source.
-
Add fixed costs and planned marketing spend to the same table.
-
Read the shape of the net line — not just the total — and make the staffing or budget call it implies.
Here's what a reforecast table looks like when it's built for actual staffing and budget calls:
| Item | Month 1 | Month 2 | Month 3 |
|---|---|---|---|
| Adj. commission from current pipeline | $58k | $31k | $14k |
| Expected from new lead inflow | $6k | $22k | $40k |
| Total forecast | $64k | $53k | $54k |
| Fixed costs (rent, tools, base) | $28k | $28k | $28k |
| Marketing spend (planned) | $9k | $9k | $12k |
| Net | $27k | $16k | $14k |
The shape of that table is where the decisions live. Month 1 leans almost entirely on the existing pipeline while month 3 leans on future leads. That's normal and important — it means your near-term number is fairly locked, but your month-3 number is only as good as your lead generation is right now. If month 3's inflow line looks thin, you don't wait. You increase marketing this month, because leads generated today are what fill that far column.
This is also where attribution work pays off. If you don't know which channels reliably produce closable leads, the "expected from new lead inflow" row is a guess. Pairing this reforecast with a real lead-source attribution model turns that row from a hope into a projection you can actually defend.
A visual workflow makes the monthly rebuild and weekly inputs clear to everyone.
Making staffing calls from the reforecast
The practical payoff is stopping yourself from making hiring and spending decisions off feelings. A few patterns worth acting on:
-
Three straight months of net below your comfort floor → freeze new spend, don't add headcount, and dig into stage decay.
-
Month 1 strong but months 2–3 collapsing → your closing engine works but your lead engine stalled. Push marketing now.
-
All three months rising steadily with pipeline outpacing capacity → this is the only clean signal to add an agent or an admin. Growth in the far months, not a good week.
These aren't complicated calls. They're just hard to make confidently without a number you trust.
Where this system quietly falls apart
A short-cycle forecast is only as good as the data feeding it, and there are predictable places it breaks in small agencies.
The most common is update lag. An agent closes a deal on Thursday and doesn't update the stage until the following Tuesday. Your Friday forecast is wrong in a way nobody notices until it matters. The fix isn't nagging — it's making the update take ten seconds and happen where the agent already works, not in a separate system they have to remember to open.
The second is stage-skipping. A deal jumps straight from "Qualified" to "Under Contract" because the agent forgot to log the offer stage. It sounds harmless, but it destroys your ability to calibrate multipliers over time, because you never see how many "Offer" deals actually convert. Enforce the sequence.
The third is the phantom close date. Everyone marks deals as closing "this month" because it's optimistic and vague. When 40% of your forecast is attached to a fuzzy date, the reforecast is useless. Require a specific expected date and let the weekly checkpoint move it.
This is the kind of coordination problem that operational software handles well — not because it's clever, but because it removes the manual steps where data goes stale. When stage changes, decay timers, and close-date reminders run automatically inside the workflow agents already use, the forecast stays current without anyone maintaining a spreadsheet by hand. The value isn't the automation itself; it's that the number you're staffing against is actually true on any given day.
A real scenario
A four-agent brokerage in a mid-size market was forecasting off gross pipeline and got burned twice in one quarter — once when they brought on a part-time admin right before three "sure" deals fell through, and once when they cut marketing during a stretch that looked slow but was really just a data lag.
They switched to stage-based multipliers with weekly checkpoints. The first honest reforecast was uncomfortable: their "$310k pipeline" was really about $71k in confidence-adjusted commission for the coming 90 days. But it was real. Within two months, the reforecast caught a thinning month-3 inflow line early enough to bump marketing spend by roughly $2k–$3k and backfill the gap before it hit. Over the next two quarters, the gap between forecasted and actual quarterly commission tightened from 30–40% off to landing within about 10%. Nothing about their sales changed. They just stopped planning against a number that was never going to happen.
When this makes sense — and when it doesn't
This system is worth building if you have three or more producers, run more than a handful of live deals at once, and make actual spending or hiring decisions off your revenue outlook. The coordination cost only pays back when there's real coordination to manage.
It's overkill for a solo agent with five deals in flight. You already know the true state of each one, and a lightweight spreadsheet updated weekly does the job. Forcing a full stage-and-multiplier system on that volume just adds admin with no real return.
And it's a bad idea if your team won't keep the data current. A short-cycle forecast run on stale inputs is worse than no forecast, because it looks precise while being wrong. If you can't get consistent weekly updates, fix that habit before you build the model. The forecast is downstream of clean data, and no multiplier survives an empty checkpoint.
The agencies that get real value from this aren't the ones with the fanciest model. They're the ones who run the weekly checkpoint every single week without fail, keep their multipliers honest, and treat the 90-day reforecast as a decision meeting instead of a report they file and forget. Do that consistently and the forecast stops being a guess you dread and becomes something you can actually run the business on.
Ready to elevate your real estate business?
Join 2,000+ agencies using TryRealy to streamline operations, close deals faster, and deliver exceptional client experiences.